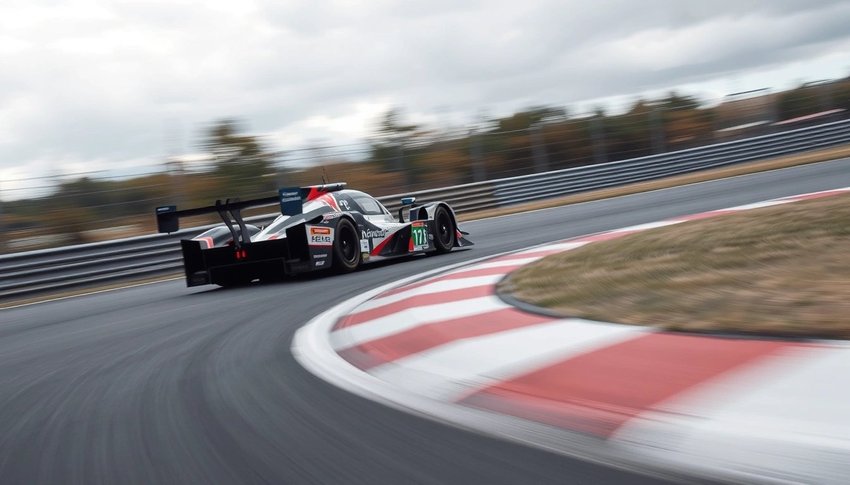
Photo by Dora Petrakis
A race engineer almost never watches the car with their eyes first. They watch the data log. Sector times, brake pressure traces, tyre temperature curves, the tiny delta between one lap and the next. The cars in the archive here at Racing Sports Cars look gorgeous frozen mid corner at Spa or Sebring, but the people who built and ran them lived inside telemetry traces, hunting for a quarter of a second hidden in a throttle map. The photograph is the romance. The numbers are the truth.
That habit of mind, the instinct to distrust the surface and read the underlying figures, is the whole craft of modern motorsport engineering. A driver swears the car is understeering on entry. The steering trace and the front tyre temperatures often say the problem is actually mid corner, two tenths later. The data does not care about the story a driver tells. It corrects it. That same numbers first instinct shows up in unexpected corners of life too, such as a data led look at the Alberta casino market, but on a race weekend the discipline is pure and unforgiving: measure everything, trust the trace, find the time.
This piece is written for readers who think the way racing people think. We are going to walk through the channels a race engineer actually reads, from sector splits to brake pressure to tyre temperature, and show how each one turns into a decision on the pit wall. No mystique, just the readout and what it means.
The Data Log Comes Before the Eye
Telemetry works because it forces discipline. Human memory is a terrible instrument. A driver remembers the corner that scared them, not the corner that cost them, and those are rarely the same corner. The log has no ego. It records every input and every response at hundreds of samples per second, and when the car crosses the line the engineer has a complete, honest account of the lap before the driver has even taken off their gloves.
A modern prototype or Hypercar can carry well over a hundred data channels. Wheel speeds at each corner, damper positions, steering angle, throttle and brake pressure, gear, engine temperatures, fuel flow, and a full suite of accelerometers reading the forces through the chassis. The engineer does not read all of them at once. The art is knowing which three or four channels answer the question in front of you, and ignoring the rest until they matter. This continuous transmission of measurements from the car back to the garage is the core idea behind telemetry, and it is what separates a guess from a diagnosis.
The advantage of reading the car this way is that it removes argument. Two engineers can disagree about how a car feels forever. They cannot disagree about a brake pressure trace that clearly shows the driver lifting off the pedal fifteen metres before the apex. The number ends the debate, and on a tight schedule that is worth real time.
Sector Times: The First Place to Look
Before anyone opens a single detailed trace, they look at sector times. A lap is usually broken into three timed sectors, and a good timing system splits it far finer than that, into dozens of mini sectors or into speed at named points on the circuit. The sector split is the triage tool. It tells the engineer where the time is going without asking them to read anything more complex than a column of numbers.
The power of sector timing is comparison. Put the driver's best sector one next to their best sector two and their best sector three, and you build a theoretical best lap that no single flying lap actually achieved. The gap between that theoretical best and the real best lap is the driver's inconsistency, and it is often larger than anyone expects. Comparing a driver against a team mate in the same car does the same job from another angle. If one driver is quicker in the fast sweeps and slower in the tight complex, the difference is rarely the car. It is technique, and the split makes that visible.
Sector times also carry the first warning of trouble. A driver losing two tenths in the same sector lap after lap, while the rest of the lap holds steady, is telling you something specific is wrong at that point on the circuit. Tyre drop, a fuel load effect, a gust of wind down a particular straight. The split narrows the search before you spend time in the deeper channels.
The Brake Trace Tells the Truth
If sector times point you to a place, the brake trace tells you what happened there. Brake pressure plotted against distance is one of the most revealing channels an engineer has, because braking is where drivers differ most and where lap time is most often won and lost.
A confident brake application looks like a sharp spike to peak pressure followed by a smooth, controlled release into the corner. That release, the trailing off of brake pressure as the car turns in, is where the real skill lives. A driver who releases the brake too early runs wide and scrubs speed. A driver who trails the brake deep and smooth keeps the front tyres loaded and the car rotating. Two drivers can hit the same peak pressure and post completely different corner speeds because of what their trace does in the final fifty metres before the apex.
The brake trace also exposes the car. Compare the same driver across ten laps and a shifting braking point can reveal a tyre losing grip, brakes fading with heat, or fuel burn changing the balance. In endurance racing, where a car runs for hours and drivers share the cockpit, the brake trace becomes a shared language, showing at a glance whether a change in lap time came from the driver, the tyres, or the machine.
Tyre Temperature and the Long Game
Sprint racing is about the perfect single lap. Endurance racing, the discipline this archive lives and breathes, is about the perfect stint, and no channel governs a stint more than tyre temperature. A tyre has a working window, a band of temperature in which the rubber generates its designed grip. Below it the tyre is cold and slides. Above it the tyre overheats, greases up, and falls away just as quickly.
Engineers read tyre temperature across the width of each tyre, inner, middle, and outer, because the spread tells them about the car's geometry and the driver's habits. A front tyre running hot on the outer edge points at too much camber or a driver leaning on the front too hard through long corners. A rear pair climbing steadily over a stint warns that the tyres are giving up before the fuel does, which changes the entire pit strategy. At a long, fast, punishing circuit like Spa Francorchamps, where the sweep through Eau Rouge and Blanchimont loads tyres relentlessly, temperature management is often the difference between a car that fades in the final hour and one that comes on strong. The reports in this archive, such as a detailed account of a recent Spa endurance round, are full of races decided exactly there, in the slow degradation of grip that only the data ever saw coming.
The long game reading is patient. One hot lap of tyre data is noise. A trend across a full stint is information, and the engineer who reads it early wins the pit lane by calling the stop at the right moment rather than the panicked one.
Throttle Maps and the Delta Channel
On the exit side of a corner, the throttle trace does what the brake trace does on entry. It shows how early and how smoothly a driver gets back to power, and how the car accepts it. A driver who can squeeze to full throttle a fraction earlier, without the rear stepping out, carries that advantage all the way down the following straight, where it compounds into real distance. The throttle channel plotted against wheel speed also reveals traction problems the driver may not even feel, the brief moments where the rears break traction and the electronics intervene.
The single most useful derived channel, though, is the delta. The delta compares the current lap against a reference lap in real time, showing at every point on the circuit whether the driver is ahead of or behind the benchmark. It turns the whole complicated picture into one moving number. An engineer watching the delta live can see a driver gaining through a sector and losing it all back under braking for the next corner, and can radio a single precise instruction rather than a vague one. The delta is the summary the pit wall stares at, because it answers the only question that ultimately matters: are we faster than we were, and where.
What Each Channel Tells an Engineer
The channels only mean something when you know the question each one answers. Here is the readout in one place, the way an engineer would keep it in their head while scanning a lap.
| Data channel | What it measures | What it tells the engineer |
|---|
| Sector and mini sector times | Elapsed time across parts of the lap | Where time is being gained or lost, before any deeper trace is opened |
| Brake pressure trace | Force on the pedal against distance | Braking point, peak pressure, and the crucial trailing release into the apex |
| Tyre temperature | Heat across inner, middle, and outer tyre | Whether tyres are in their working window and how the car is loading them |
| Throttle position | How early and smoothly power is applied | Corner exit quality and hidden traction losses on the way to the straight |
| Steering angle | Driver input at the wheel | Understeer or oversteer, and how much correction the car demands |
| Wheel speed | Rotational speed at each corner | Locking under braking, traction loss under power, and true cornering speed |
| Lap delta | Live gap to a reference lap | The single summary of whether this lap is faster, and precisely where |
Read down the column and a method appears. The timing channels tell you where to look. The pressure and temperature channels tell you what is happening there. The delta ties it all back to the only currency that counts, which is time.
Endurance Racing Multiplies the Data
A sprint race asks the data to describe one car over a handful of laps. An endurance classic like Le Mans, Sebring, or the Spa twenty four hours asks it to describe several drivers, changing weather, tyre after tyre, and a car that is quietly wearing out, all across a full day and night. The volume of information is enormous, and the engineering challenge shifts from finding a single fast lap to managing a moving average that has to stay strong for hours.
This is where reading data becomes strategy rather than tuning. Fuel flow is regulated and monitored closely in modern prototype and Hypercar categories, and the sport's governing body publishes the technical framework that defines these cars, so the engineer is always balancing pace against consumption inside a fixed set of rules. Push a tenth harder per lap and the tyres and fuel may not reach the planned stop. Back off a fraction and a rival stretches a gap that becomes impossible to close before the flag. The data is what lets a team walk that line deliberately instead of by feel, projecting a full stint forward from the first few laps and adjusting the plan while there is still time to act.
Night brings its own reading. Track temperature falls, grip changes, and the tyre channel that told one story at noon tells another at three in the morning. The teams that win the great endurance races are usually the ones that read those shifts early and calmly, trusting the trace over the tired instinct of a long stint.
Turning Numbers Into Decisions
None of this matters if the data just sits in a log. The whole point of reading the numbers is the decision at the end of it. Change the front anti roll bar or leave it. Bring the car in now or run two more laps. Ask the driver to brake five metres later into the fast chicane or to protect the tyres for the final hour. Every one of those calls is a judgement made on what the trace is telling you, with a stopwatch running.
The best engineers hold two things at once. They respect the data completely, and they know exactly how far to trust it. A single suspicious number gets the same treatment a suspiciously fast lap time should always get: ask who measured it, over what sample, and against which reference. The figure that survives those questions is the one worth acting on. That is the discipline behind every car in this archive, and it is why, long after the engines went quiet, the numbers still explain exactly how each of them found its lap time.
Frequently Asked Questions
What is telemetry in motorsport?
Telemetry is the continuous transmission of measurements from a moving race car back to the engineers in the garage. Sensors across the car record channels such as wheel speed, brake and throttle pressure, steering angle, tyre temperature, and the forces through the chassis, hundreds of times per second. Engineers read those channels to understand exactly what the car and driver are doing at every point on the circuit.
Why do engineers look at sector times before anything else?
Sector times are a fast triage tool. Splitting a lap into timed sections shows where time is being gained or lost without opening any complex trace. Comparing a driver against their own best sectors, or against a team mate in the same car, quickly reveals whether a problem is technique or machinery, and narrows the search before the engineer dives into the deeper data.
What does a brake pressure trace reveal?
A brake trace plots pedal force against distance, showing the braking point, the peak pressure, and how smoothly the driver releases the brake into the corner. That trailing release is where much of the lap time lives. The same trace across many laps can also expose fading brakes, dropping tyres, or a shifting balance as fuel burns off.
Why is tyre temperature so important in endurance racing?
A tyre only delivers its designed grip inside a narrow temperature window. Too cold and it slides, too hot and it greases up and falls away. Over a long stint, reading temperature across each tyre tells the engineer whether the car is loading the rubber correctly and when grip will drop, which drives pit strategy in races that last for hours.
What is a lap delta and why do teams watch it live?
A lap delta compares the current lap against a reference lap in real time, showing at every point whether the driver is ahead of or behind the benchmark. It condenses a complicated picture into one moving number, so the pit wall can see instantly where time is being gained or lost and give the driver a single precise instruction rather than a vague one.